Slashdot had a story recently on how in 1942, the allies were able to estimate the number of German taks produced based on the serial numbers of the tanks. In 2010, a German hacker is doing the exact same thing with Xboxes. This article describes the generic approach, shows some results, and provides previously unreleased raw data of 14,000 Xbox serials so you can do your own statistics!
Between October 2003 and January 2005, the Xbox Linux Project asked all visitors to their website to enter their Xbox serial numbers, date and country of manufacture, ROM version, hard disk and DVD drive brand and other properties, and gathered more than 14,000 entries. The original idea was to find a rule to deduce the hard disk and DVD drive types in an Xbox by only looking at the serial number, which was visible through the unopened packaging.
The serial sticker on an Xbox looks like this:
MFG. DATE  2002-03-03
SERIAL NO. 1166356 20903
After looking at several serial numbers, it was already clear that the last two digits (“03” in my example) are the location of manufacture: 02 is Mexico, 03 is Hungary, 05 is China and 06 is Taiwan. The three digits before (“209” in my example) are the one-digit year (“2” for “2002”) and the two-digit calender week (“09” for around the first week of March).
Now we want to find out how many devices were manufactured. A first approximation is to look at the manufacturing dates of all Xboxes in our database.
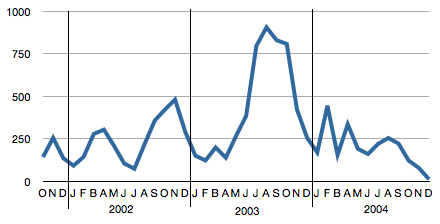
This gives us an idea when production was ramped up (in 2001 and 2002 in November, and in 2003 in August, September and October), but the statistics don’t give us absolute numbers, and they are biased towards older devices (newer devices are not entered yet, and visitors of our site tend to be early adopters).
But what about these first seven digits of the serial number? Shouldn’t these be actual “serial” numbers? Let’s look at all devices from August 2003 and sort the first seven digits by manufacturing date:
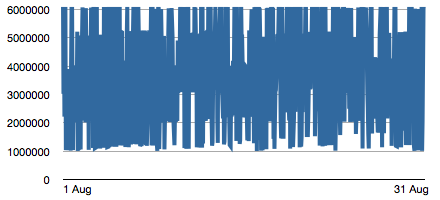
This does not look like a serial number. But all numbers are > 1,000,000, which implies that the first digit has a special meaning and is not part of the number. Let’s look at distribution of the first digit:
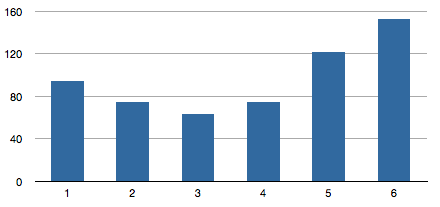
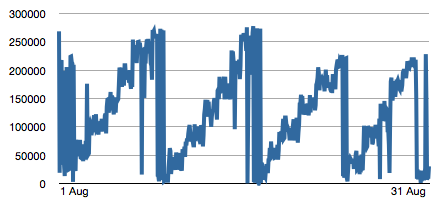
The first digit seems to be the number of the assembly line in the factory! So let’s look at the remaining 6 digits again:
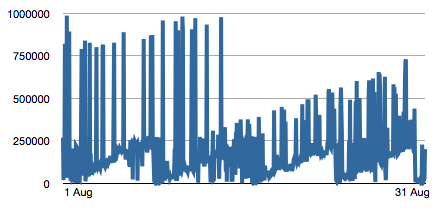
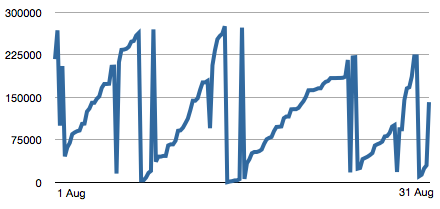
This looks a lot better! But there are several things interleaved in this chart – because the serial numbers are of course counted independently in every factory. If we filter just all numbers form the Chinese factory, we get this:
We can see serial numbers are counted up every week, but we still see all assembly lines interleaved here, and the different lines don’t reset at the same time. Here is line 6 all by itself:
Looks almost perfect, if we assume the wild shots are caused by typos. Here is a manually fixed version of it:
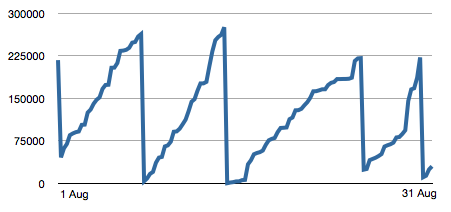
Voilà! Serial numbers that count up monotonically and get reset on every Sunday.
By inspection of the graph, we can estimate that assembly line 6 of the factory in China produced about 275,000 devices per week in week 33 (mid August) of 2003. This works well, because we have so many samples; but for other weeks, we have as few as five. This is the formula for the German Tank Problem:
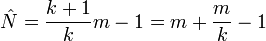
k is the sample size and m s the highest serial number observed.
The estimate of Xboxes produced by assembly line 6 in China in week 33 of 2003 is therefore 285,269. Applying this to every assembly line of every factory and every week, it should be easy to get great statistics on the productivity of the different lines and factories, as well as a very good estimate of the total number of devices produced. …and this is where you come in!
The Data
You want to do your own statistics? Here is the raw data:
xbox_serials.csv (2.5 MB)
It is a comma-separated-value file with the following columns:
| Column | Example | Description | Comment |
| 1 | 2002-03-03 | Manufacture Date | YYYY-MM-DD |
| 2 | 2002-04-30 | Date of Purchace | YYYY-MM-DD |
| 3 | de | Country of Purchase | two-digit code |
| 4 | 1166356 20903 | Serial Number | nnnnnnn nnnnn |
| 5 | v1.0 | Xbox Version | motherboard revision |
| 6 | 3944 | Kernel Version | ROM version as shown in “About” dialog |
| 7 | 4034 | Dashboard Version | HD software version as shown in “About” dialog |
| 8 | Unknown/Other | Flash | what’s printed on flash ROM chip |
| 9 | PAL | Video Standard | PAL or NTSC |
| 10 | Black | Case Color | Xboxes are black, but there are some special editions |
| 11 | Thomson | DVD Drive | Philips, Samsung, Thomson |
| 12 | Seagate 10 GB | Hard Disk | Seagate or Western Digital |
| 13 | Conexant | Video Encoder Brand | Conexant, Focus, Xcalibur |
| 14 | Golden Xbox | comments | free-form field |
Please note that people were able to fill some fields with arbitraty data, so they might not necessarily be in exactly the specified form. There are also lots of typos in the serial numbers and the month and day fields in the data fields have been mixed up sometimes. You probably want to run a script over the data first that sanitizes some of the input, e.g. removes dashes and spaces from serial numbers etc.
Here are some ideas on what you might want to find out:
- Is there a better formula to estimate the number of Xboxes produced per week on a certain assembly line?
- What day does a week start with? Does the factory produce Xboxes on Sundays? Do they produce just as many? Is it different in the respective countries?
- How many Xboxes were produced per assembly line, per week and per factory?
- Are all assembly lines in a certain factory just as productive?
- Are all factories just as productive (per assembly line)?
- Did productivity go up over time? Did it hit a maximum?
- How many Xboxes were produced total?
- Does an assembly line in a certain factory use all the same flash chips, hard drives and DVD drives in a certain week?
- When did an assembly line in a certan factory switch between board revisions?
- How long does it take an assembly line to be reconfigured for a different board revision?
- When did factories open/close? When did assembly lines get created and torn down in certain factories? Is there a correlation? Did assembly lines get migrated between factories? How long does this take?
- How long does it take on average for an Xbox from manufacuring to when it’s bought, per country? Does it change over the years?
- Which factories serve which countries? Did it change?
- How do ROM version, HD software version, motherboard version and video encoder brand correlate to each other?
- Which countries have PAL, which have NTSC?
- Where were the non-black Xboxes made?
- What percentage of Xboxes has a Philips, a Samsung or a Thomson DVD drive?
- What is the distribution of hard drive types?
- Some people claim they have a 20 GB hard drive. How credible is this?
- When and at which factories were certain DVD and HD types introduced?
- Over time, how did the distribution of DVD and HD types change?
- What is the distribution of flash chips, how did it change, and how does it correlate to factories?
- Is there enough data to make statements about the refurbishment process (search for “refurb” in comments)?
- What percentage of people misses a digit when trying to type in 12 digits?
- What percentage of people replaced digits of the serial number with an ‘X’ or a ‘*’? What percentage of these chose the right digits to properly anonymize their serial numbers?
- Any more interesting observations you can come up with?
Please share your ideas as well as your results (plus source code of your scripts, please)! If you know any statistics teachers looking for a large real-world data set and an interesting set of problems, feel free to refer them to this site! 🙂

Awesome! I particularly like the graphs. That all your work? 🙂
lovely, but you could have saved yourself a lot of hassle if you had just asked Microsoft how many they’ve sold.. I don’t think it’s a huge secret..
Still, this is a far more interesting and in-depth analysis.
But, of course, what we really want to know if whether you’re presenting anything at 27C3. 🙂
pretty insightful. the graphs were cool (and made it easier to digest!)
whoa! nice pic. I always imagined xboxes were made in factories, not labs.
that’s cool!
http://tech.rawsignal.com
Close but not quite. I think you formula is overestimating volume significantly. the combined output of both factories used in china was never greater than 350K per week. Saying that 1 line made 285K in one week is flat out wrong; this means that the factory could make 1.7M units in 1 week if all lines were outputing 285K! We would have loved to have that capacity in place at times, but it was never that large. There were only between 25M-30M Xbox 1.0s made over its life.
The factory in Mexico was sized to output just north of 100K per week, Hungary just below 100K, and each factory in China just around 100K as well. All 3 sites were never in production at the same time, and there was never a manufacturing site in Taiwan.
Great analysis! The German tank problem applied to Xbox serial numbers is genius. I love how you broke down the first digit as assembly line and the remaining 6 as actual counters.
One thing though – as someone who worked in manufacturing around that time, I suspect the 285K/week estimate for a single line might be too high. Total Xbox production was ~25-30M units over the lifetime. Still, the dataset is a goldmine. Would love to see more on DVD drive correlation with serial ranges!
Thanks for sharing the raw data – definitely playing with this over the weekend.